Lock-in thermography

Precise defect analysis down to below the surface

Lock-in thermography excites components with periodically modulated heat input and records them with an infrared camera. From the measured image sequence, phase and amplitude images are generated that reliably reveal delaminations, air inclusions, bonding defects, or variations in material thickness, contactless, non-destructive, and suitable for inline use.

Frontalansicht eines Thermografiesystems mit Prüfobjekt (OTvis)
PlayButton

Lock-in thermography

Otvis prinzipskizze - englisch

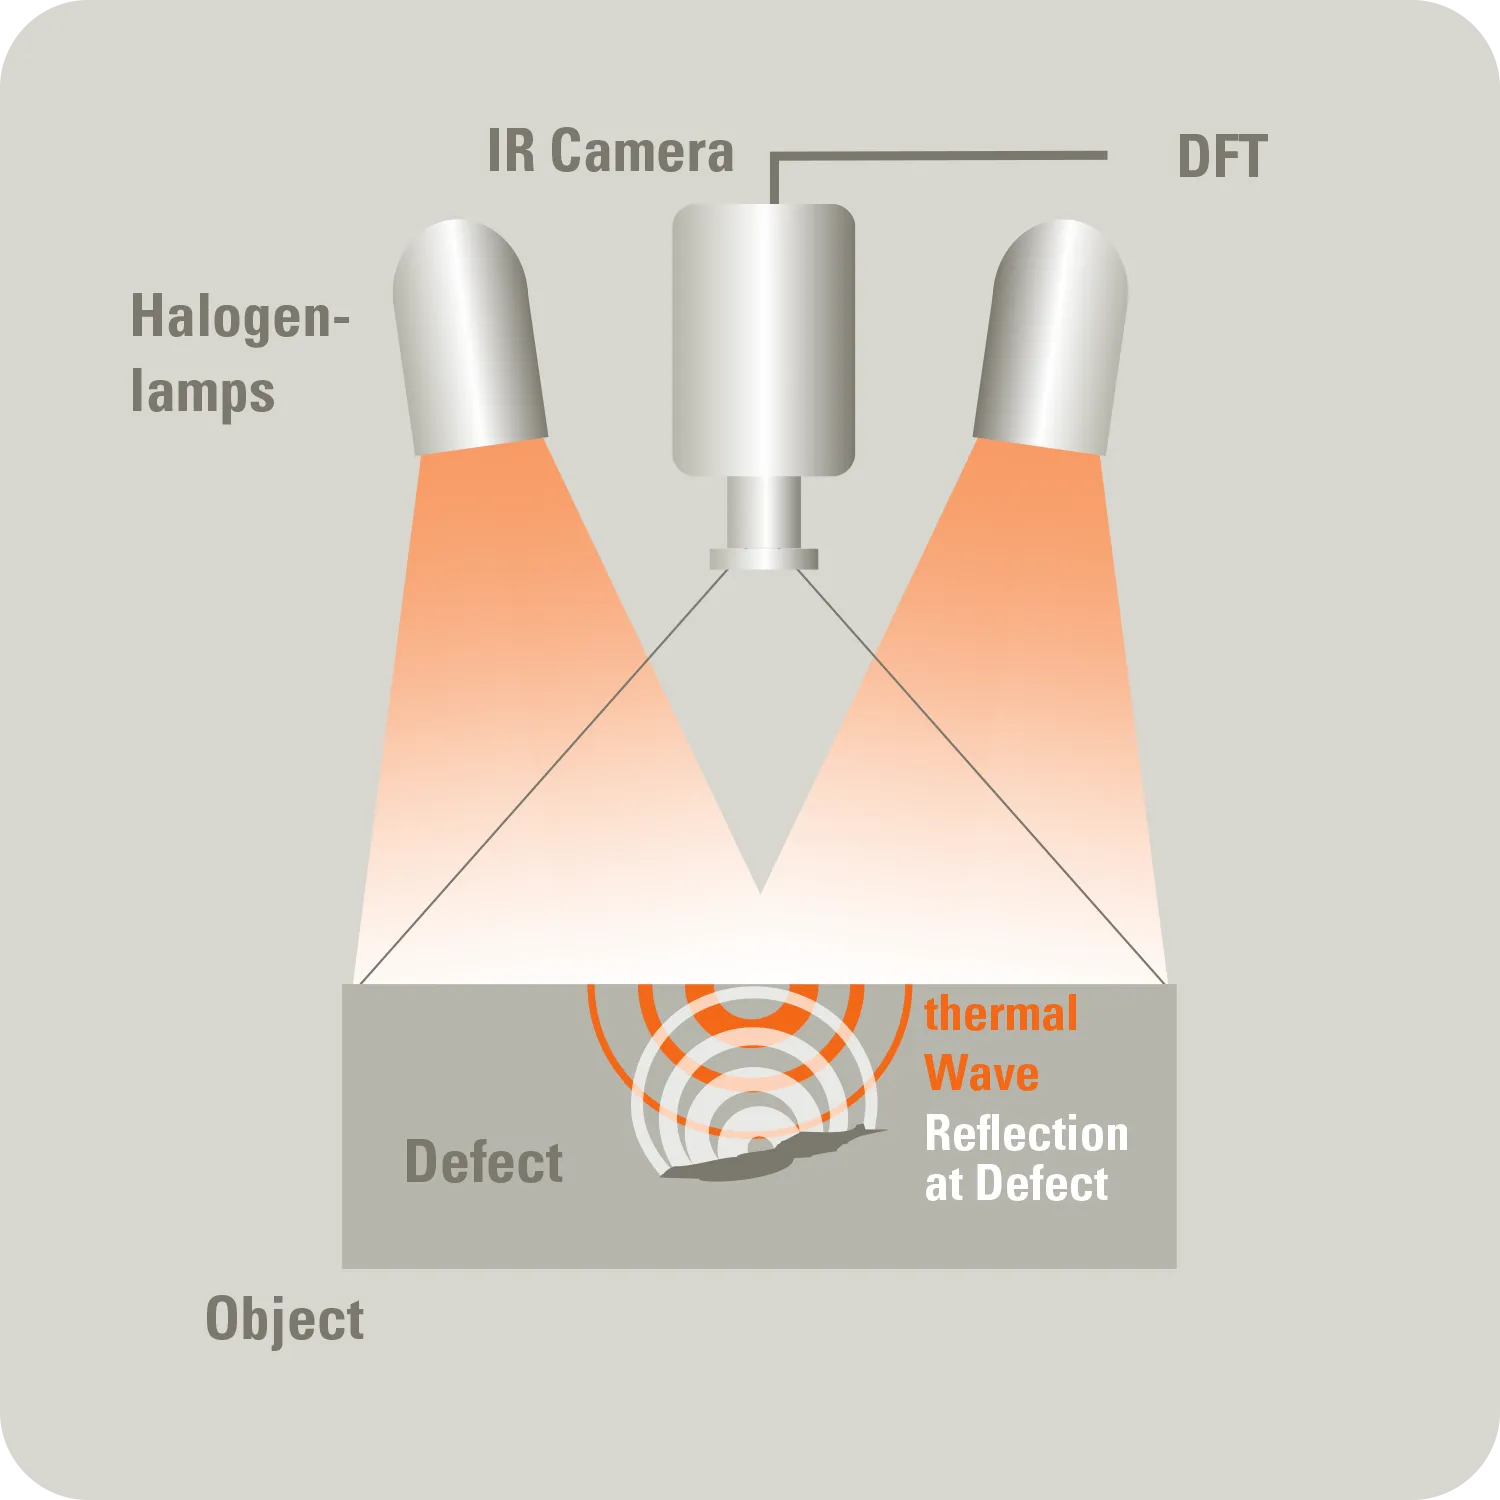
What is lock-in thermography? – Brief explanation

Lock-in thermography is a method of optical active thermography: The component is excited with periodically (sinusoidally) modulated heat—typically via halogen lamps—while an IR camera records synchronously. The resulting thermal waves penetrate the material; at defects such as pores, delaminations, or bonding interruptions, the heat flow is altered. Fourier evaluation of the image sequence calculates phase and amplitude images, which significantly reduce interference effects (e.g., differences in emissivity or illumination) and increase detection reliability.

Benefits

Depth-resolved defect detection for typical composite/layered applications

Large-area inspections in a single pass (static setups)

Phase analysis reduces interference effects (emissivity/illumination)

Contactless, non-destructive, inline-capable, and automatable

Applications

Fiber-reinforced plastics and lightweight construction (CFRP/GFRP)

Adhesive bonding and plastic welding

Metals and hybrids such as corrosion undercutting, wall thickness variations, composites, and coated sheets

Large structures such as rotor blades, car body outer panels, panels

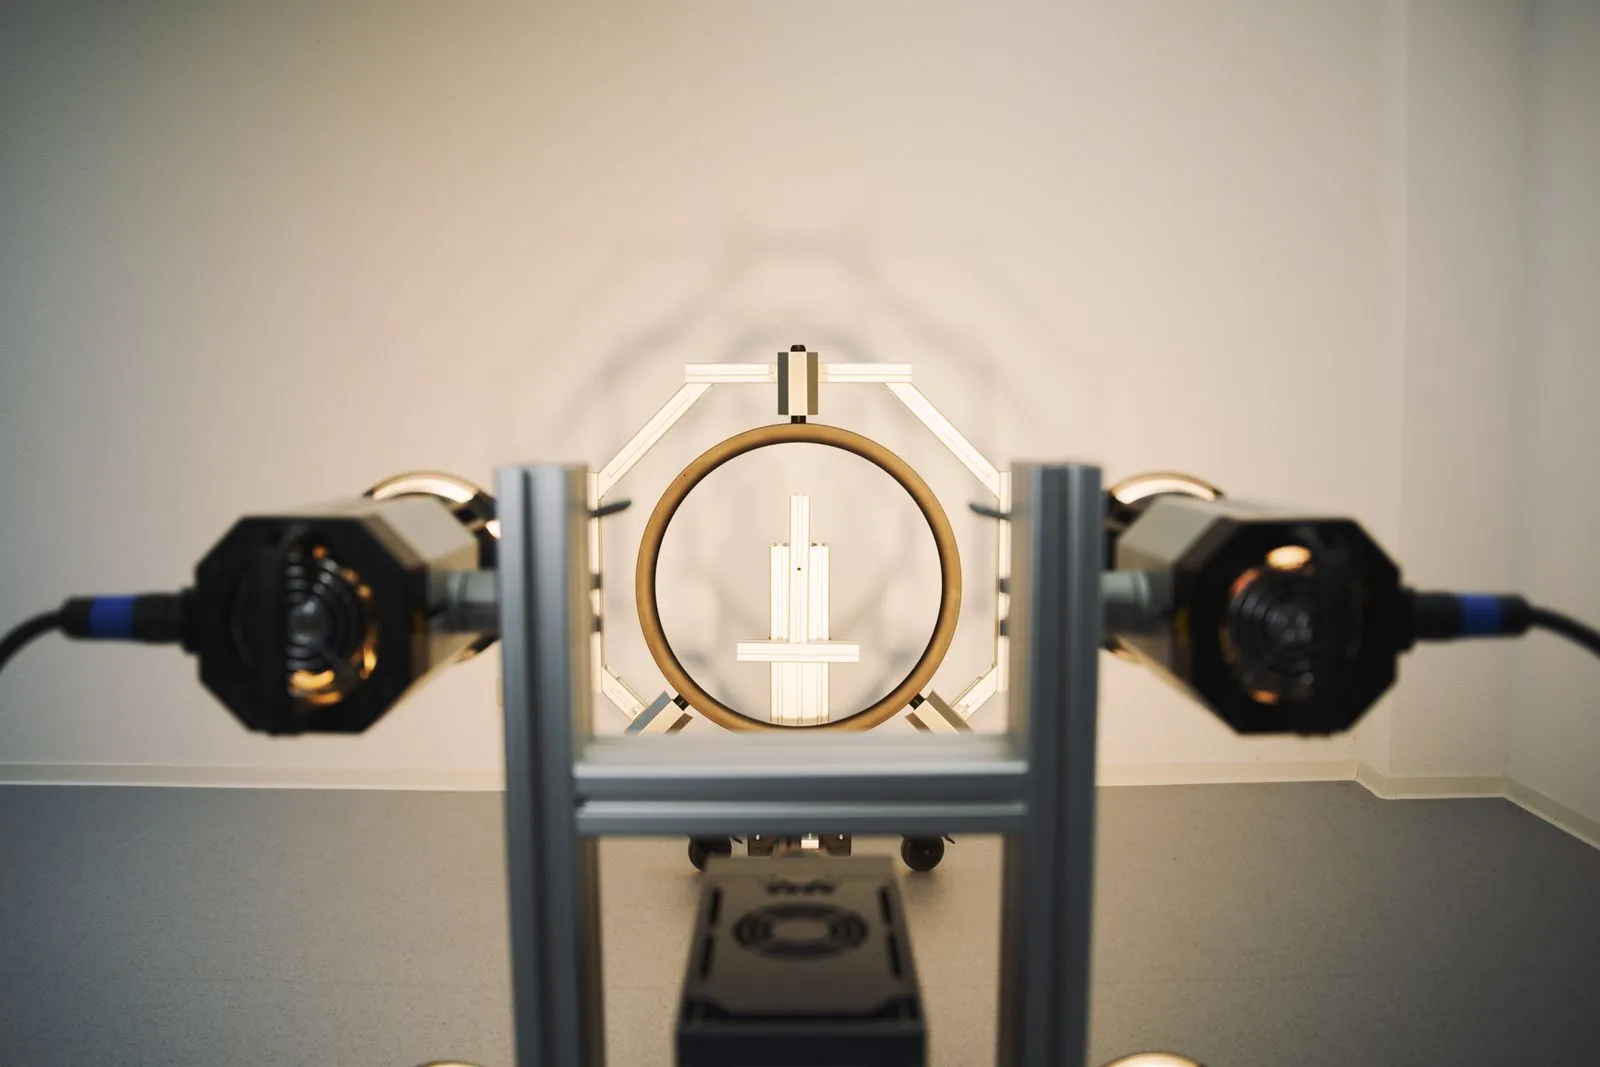
Test setup – movement

Note: Lock-in is the excitation method described on this page. Pulse (PTvis) and step (IR radiator) also belong to the optical family but are not described here in detail.

Select movement

In the static setup, the test object, optical excitation (e.g., halogen), and IR camera remain in a fixed position for the entire measurement. The heating is sinusoidal (lock-in), and the recording is synchronous; phase and amplitude images are calculated from this. Depending on the component, measurements are taken contactlessly in reflection or transmission. This configuration provides maximum signal stability and very good depth characterization.

Typical applications

  • CFRP components (delamination, impact, porosity, insert bonding)
  • structural adhesive joints (aerospace, automotive)
  • layer/wall thickness measurement on coated metals
  • corrosion under paint, plastic weld joints, rotor blades.

Benefits

A very high signal-to-noise ratio, precise depth resolution through long integration time or frequency sweep, and reproducible results make the system ideal for laboratory series and preliminary stages of inline inspection.

In dynamic operation, there is relative movement between the heat source/camera and the test object (conveyor belt, robot, axis systems). Surfaces are scanned area by area, line by line, or point by point. For stable phase analysis, a sufficient number of modulation cycles must be recorded per spatial region; movement and image acquisition are therefore precisely synchronized (e.g., via encoder trigger). This enables high throughput with controlled image quality.

Typical applications

  • Long adhesive seams at conveyor speed
  • Large-area inspection (rotor blades, panels)
  • Dynamic spot checks on large structures

Benefits

Significant time savings for large inspection areas; easy integration into robotic, portal, or axis systems.

Calculation: Thermal diffusion length

The lock-in frequency determines how deeply the thermal wave penetrates into the material.
The decisive parameter for this is the thermal diffusion length μ, which depends on the thermal diffusivity α and the excitation frequency f.

formel lockin -thermografie 1
formel lcokin 2

Calculator: Thermal Penetration Depth μ

Computes μ from α (m²/s) and f (Hz). Choose how to provide α.

Note: No default value is assumed until a material is selected.

Thermal penetration depth μ (mm)
Measurement duration T = 1/f (s)
Inverse: frequency f from target μ
Required f (Hz):

Formula & short explanation

μ = √( α / (π · f) )
equivalently: μ = √( 2·α / ω ), with ω = 2π·f
Visualization* μ(f) curve (log-x) & marker for f
Penetration depth (0–10 mm):
* For illustration only. Simplified view — real conditions may differ.
Note: If μ exceeds 10 mm, the curve is hidden because no quasi-steady values can be represented in that range.

Discover our testing laboratory

Whether feasibility studies, series tests or individual part analyses

Learn more

Questions about lock-in thermography?

In a short initial consultation, we explain how thermography can support you effectively — clear, transparent, and without obligation.

FAQ

Our frequently asked questions — answered quickly and easily.

All questions/answers

Can large components or complex geometries also be inspected?

Can lock-in thermography be integrated into existing production lines?

How deep can lock-in thermography detect defects?

How does lock-in thermography differ from other thermography methods?

Is the method also suitable for coated or glossy surfaces?